Featured
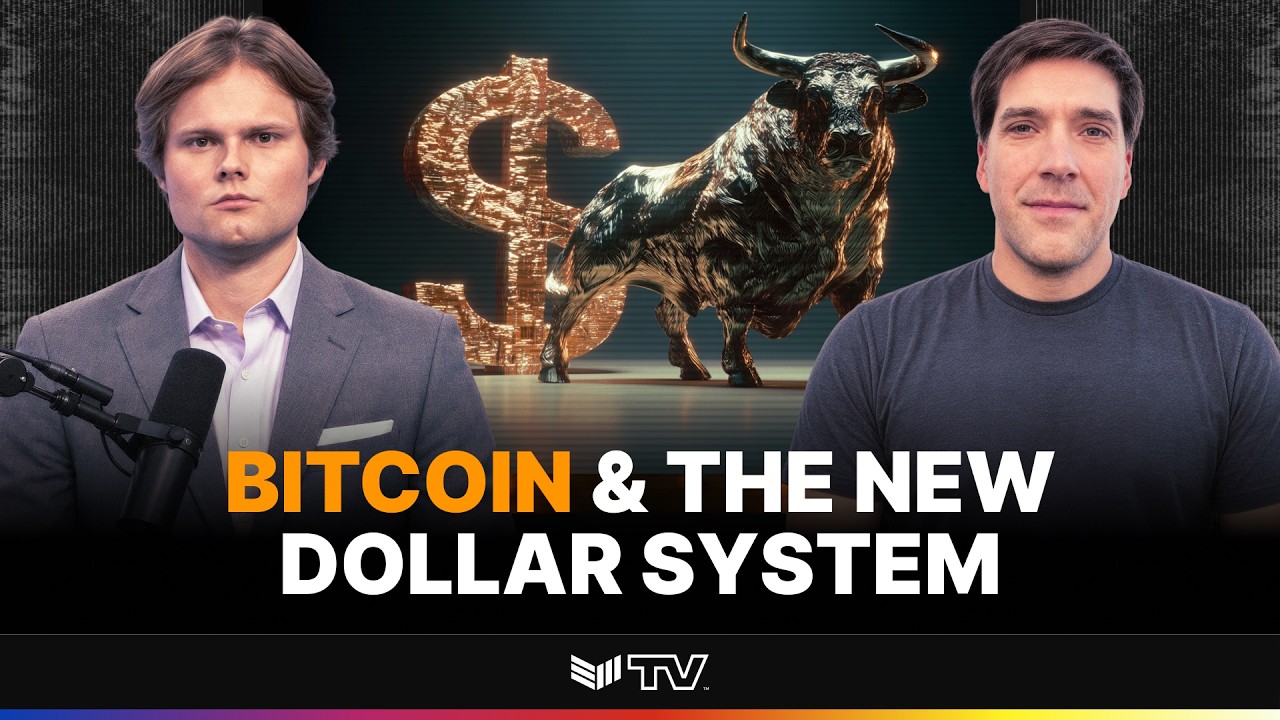
Strive buys 3,311 bitcoin for $280 million in largest acquisition since January
Strive added 3,311 BTC between Oct. 5 and Oct. 9, bringing holdings to 32,773 BTC and narrowing the gap with MARA.
theblock.co
Technology
Markets, protocols, and decentralized everything
Crypto coverage is a tax on attention. Half is shilling, the other half is doom-baiting, and the signal worth following (protocol upgrades, regulatory clarity, on-chain anomalies, real adoption) gets buried underneath both.
Owl Post reads the crypto and Web3 space with a skeptic's eye and a technologist's patience. Protocol upgrades matter when they change what the network can do in practice. Regulatory moves matter when they clarify or constrain what can be built and where. Token price moves matter less than the liquidity and market structure story underneath them. This digest separates layer-2 hype from layer-2 reality, distinguishes genuine adoption metrics from vanity stats, and reads enforcement actions from the SEC and other regulators with the same rigor it reads launch announcements.
The beat spans Bitcoin and Ethereum fundamentals, the layer-2 ecosystem and its tradeoffs, DeFi protocols with genuine usage, NFT and gaming infrastructure, stablecoin policy, and the institutional adoption story that is still being written. Owl Post pulls from on-chain analytics, credible industry publications, and original regulatory filings, not from project Discord servers and influencer threads.
If you want the read delivered with the dry skepticism this space earns, your digest can carry that tone. If you want the finance-trained analytical frame that separates structural shifts from noise, that works too. Either way, the stories are filtered for actual signal before they reach your inbox.
A daily crypto digest built for people who have been burned by hype before and want to stay informed without wading through it. This space moves fast and the stakes are real. A good filter is not optional.

KuCoin Nigeria Limited has received conditional Approval-in-Principle (AIP) from the Securities and Exchange Commission, Nigeria (SEC Nigeria), for admission into its Accelerated Regulatory Incubation Programme (ARIP). It advances the exchange’s efforts to establish a regulated presence in one of Africa’s most active digital asset markets. According to Chainalysis’ 2026 Global Crypto Adoption Index, Nigeria ranks […] This story continues at The Next Web
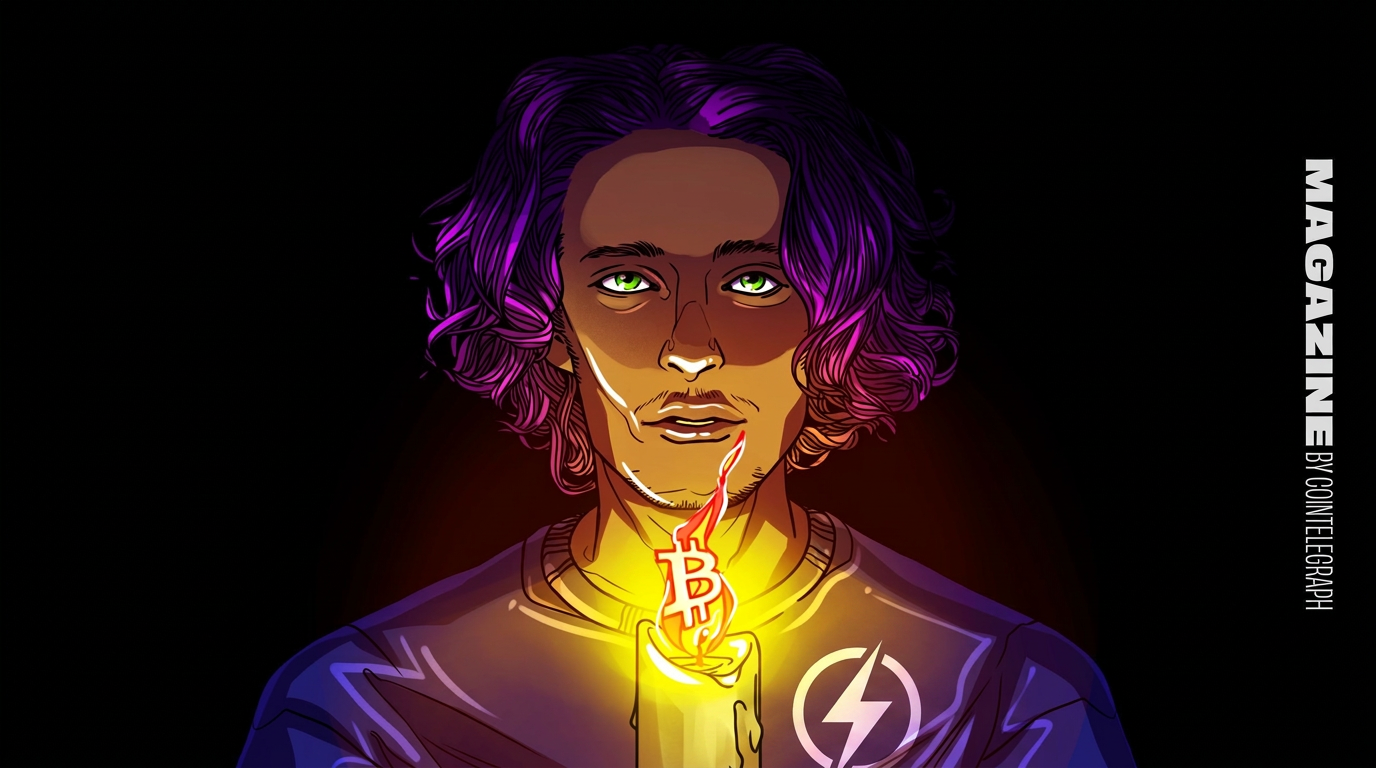
Bitcoin developer Paul Sztorc says Bitcoiners are lying to themselves about Lightning. Developers claim usability has improved, but questions remain over everyday adoption.
Owl Post delivers a personalized crypto & web3 digest every morning, curated by AI, written in your voice.
Get your free digest